mirror of
https://github.com/arch3rPro/1Panel-Appstore.git
synced 2026-06-10 16:39:39 +08:00
Tianji Introduction
Overview
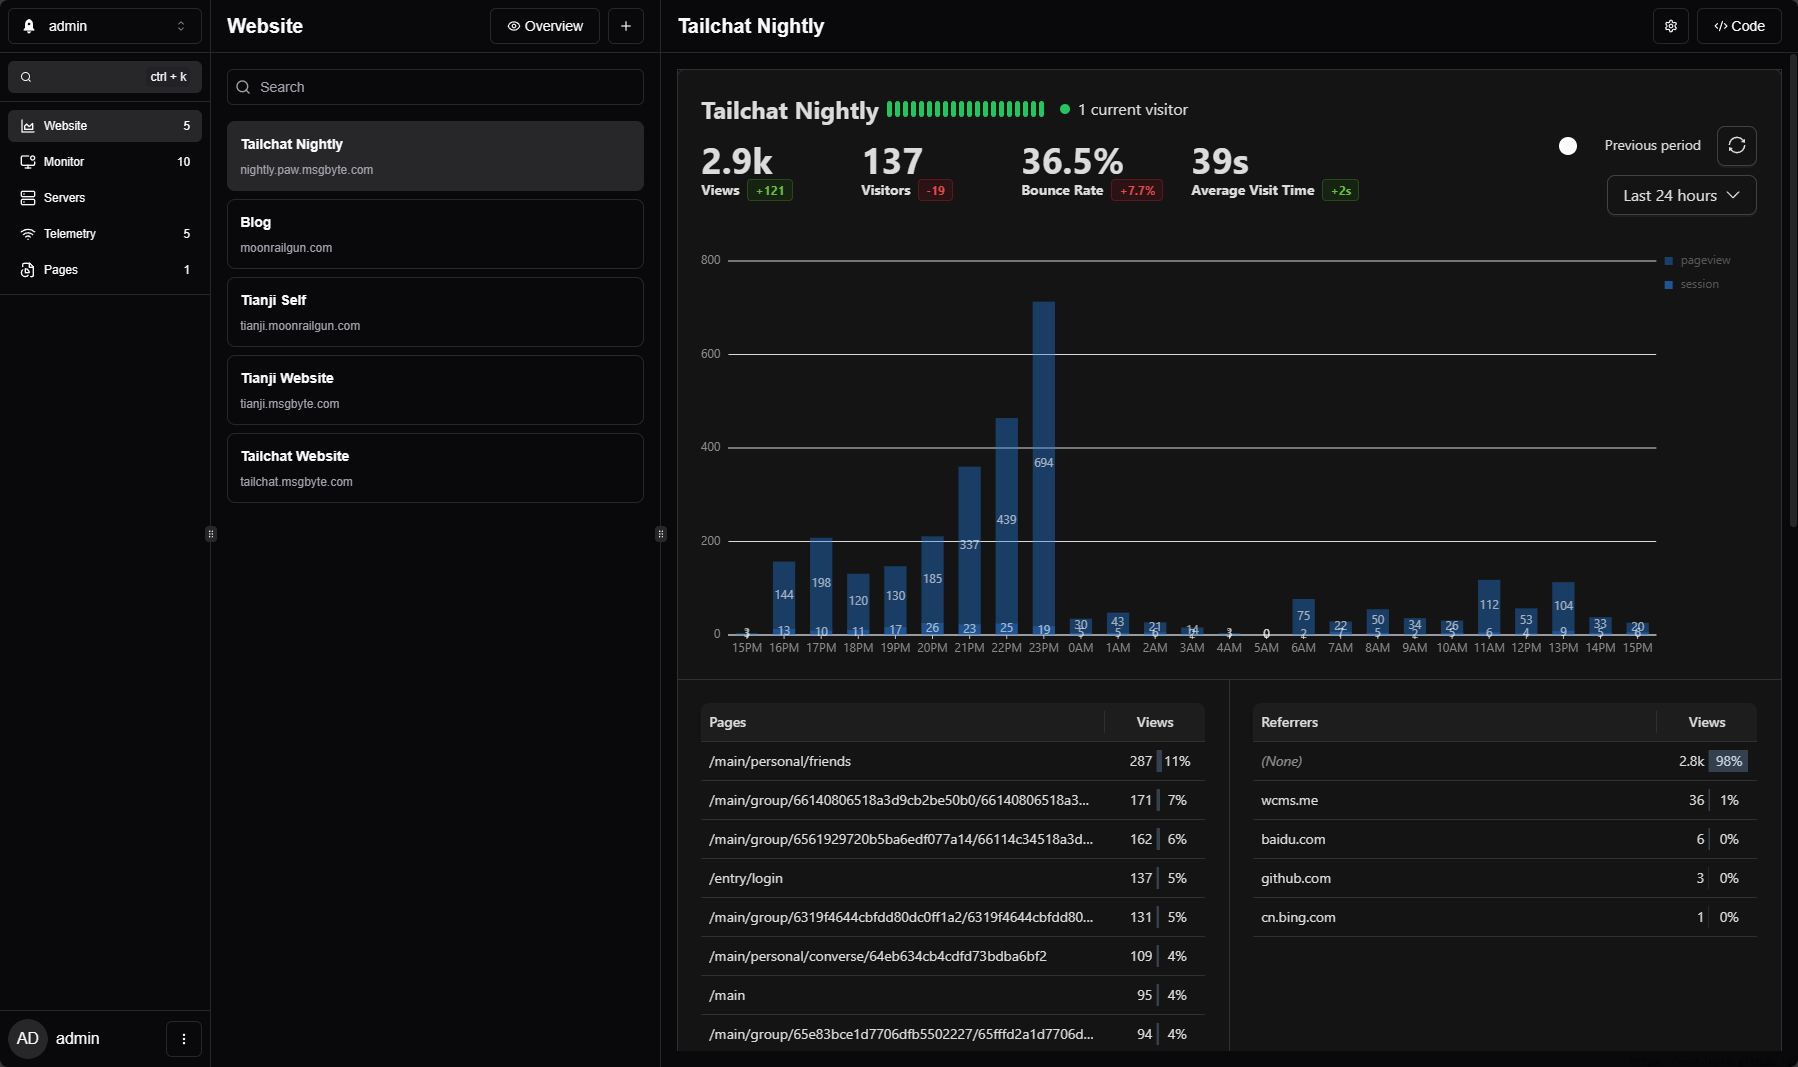
Tianji is an open-source all-in-one data insight center that integrates website analytics, service monitoring, and server status monitoring. It provides individuals and enterprises with a unified platform to monitor and analyze various data, helping users better understand their digital asset status.
Key Features
- Website Analytics: Monitor website PV/UV, online duration, bounce rate, visitor device usage, geographic location, traffic sources and more with just a script less than 2KB. Think of it as a self-hosted Google Analytics.
- Service Monitoring: Real-time monitoring of service response times, supporting HTTP, TCP, Ping and other monitoring methods. You can even write custom scripts for advanced monitoring.
- Service Status Page: Provides a public status page for external access, displaying the operational status of various services to enhance user trust.
- Server Status Monitoring: Similar to ServerStatus, monitors real-time server conditions including CPU, memory, network traffic, disk space, etc.
- Multiple Notification Methods: Supports 100+ notification methods (powered by Apprise), including email, Telegram, ServerChan, and more.
- Customizable Dashboard: Supports customizable dashboard layouts to meet different users' display needs.
- Theme Support: Supports light/dark mode switching to protect user vision.
- Multi-language Support: Built-in support for English, French, German, Japanese, Russian, Chinese and other languages.
- Open Source & Free: Based on open source license, completely free to use, supports self-hosted deployment.
Quick Start
Default Account
- Username:
admin - Password:
admin
⚠️ Important Reminder: Please change the default password immediately after first login to ensure security!
Access Method
After deployment, access through a web browser to the service address to start using. For first-time use, it's recommended to:
- Change the default administrator password
- Configure monitoring targets (websites, servers, etc.)
- Set up notification channels
- Customize dashboard layout
Core Features Details
Website Analytics
- Lightweight Tracking: Only requires embedding JavaScript code less than 2KB
- Privacy-Friendly: Data is completely under your control, no third-party tracking
- Rich Metrics: Page views, unique visitors, dwell time, bounce rate, etc.
- Visitor Insights: Device type, operating system, browser, geographic location, etc.
- Source Analysis: Traffic sources, search keywords, referral analysis, etc.
Service Monitoring
- Multi-Protocol Support: HTTP/HTTPS, TCP, ICMP Ping, etc.
- Custom Checks: Support for writing custom monitoring scripts
- Response Time Monitoring: Real-time monitoring of service response speed
- Status History: Records service availability historical data
- Alert Mechanism: Automatically sends notifications when services are abnormal
Server Monitoring
- System Resources: CPU usage, memory consumption, disk space
- Network Status: Real-time network traffic monitoring
- Process Management: Monitor key process running status
- Historical Data: Save monitoring history for trend analysis
Related Links
- Official Website: https://tianji.dev/
- GitHub Repository: https://github.com/msgbyte/tianji
- Official Documentation: https://tianji.dev/docs/intro